1600 Redondo Avenue, 2, Long Beach, CA 90804
1600 Redondo Avenue, 2, Long Beach, CA 90804
Property Description
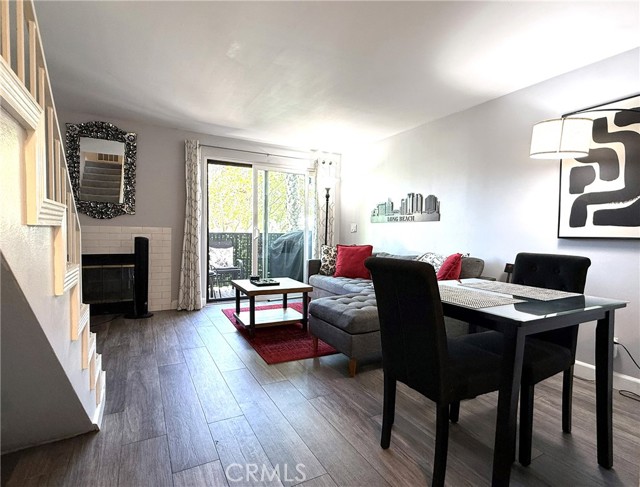
Welcome to 1600 Redondo Ave! Nestled in a charming 10-unit building and perched above ground level, this condo offers ample privacy and security. From the intimate, secured courtyard, enter the main level to a kitchen, half bathroom, living room with gas fireplace, and a welcoming balcony. Go up the steps to a full bath with tub, in unit washer and dryer with designated closet, and the loft style bedroom with cathedral ceilings and its own private balcony. One designated parking space in the secured subterranean garage. Live in historic Long Beach in this thriving neighborhood. Close to beaches, freeways, shopping, dining, and nearby parks!
Features & Amenities
Property Details
Mortgage Calculator
Current Rates
Comparative Market Analysis
Affordable Tier · 5 active · 5 closed
Long Beach · Townhouse
Listed 26.2% below the median closed sale of $535,000. Closed comps sold at 100% of list — strong seller's market.
Price Position
Priced below the market — value advantage over the field.
Active Properties (5)
Active Comparables
| Address | City | Year | BD | BTH | SqFt | LotSz | LP/SqFt | LP | DIM | Score |
|---|---|---|---|---|---|---|---|---|---|---|
| 1720 Newport Avenue | Long Beach | 1976 | 1 | 1 | 560 | 33,394 | $623 | $349,000 | 62 | 81 |
| 1035 Appleton Street | Long Beach | 1955 | 2 | 1 | 850 | 0 | $478 | $406,000 | 39 | 67 |
| 302 19th | Long Beach | 2007 | 2 | 2 | 1,000 | 40,826 | $435 | $434,998 | 22 | 64 |
| 3342 Elm Avenue | Long Beach | 1979 | 2 | 3 | 979 | 89,667 | $526 | $514,900 | 109 | 63 |
| 17 Plymouth | Long Beach | 1987 | 3 | 2 | 1,200 | 6,694 | $518 | $622,000 | 95 | 59 |
| Total: 5 · Average | 2.0 | 1.8 | 917.8 | 42,645.25 | $516 | $465,379.6 | 65.4 | |||
| Median | 979 | $434,998 | ||||||||
Closed Properties (5)
Closed Comparables
| Address | City | Year | Date | BD | BTH | SqFt | LotSz | LP | SP | SP/SqFt | SP/LP | DIM | Score |
|---|---|---|---|---|---|---|---|---|---|---|---|---|---|
| 1418 Florida Street | Long Beach | 1981 | 07/29/2026 | 2 | 2 | 964 | 7,466 | $489,000 | $494,000 | $512 | 1.01 | 33 | 76 |
| 2726 2nd | Long Beach | 1978 | 06/29/2026 | 2 | 1 | 993 | 8,288 | $699,000 | $699,000 | $704 | 1.00 | 39 | 69 |
| 2231 Santa Fe | Long Beach | 1980 | 07/27/2026 | 2 | 2 | 1,045 | 76,539 | $499,999 | $510,000 | $488 | 1.02 | 53 | 65 |
| 101 Spring | Long Beach | 1985 | 07/21/2026 | 2 | 3 | 1,020 | 46,787 | $540,000 | $535,000 | $525 | 0.99 | 67 | 63 |
| 315 Winnipeg Place | Long Beach | 1984 | 08/25/2026 | 2 | 3 | 1,206 | 24,321 | $679,800 | $680,000 | $564 | 1.00 | 90 | 55 |
| Total: 5 · Average | 2.0 | 2.2 | 1,045.6 | 32,680.2 | $583,600 | $583,600 | $558.6 | — | 56.4 | ||||
| Median | 1,020 | $535,000 | $535,000 | ||||||||||
Market Analysis
List vs Sale $/SqFt
Sale Price Trend
Days on Market
Sale vs List Price
This analysis was generated automatically from MLS data. For an in-depth, human-reviewed valuation, contact Joseph Sardella at josephsardella@gmail.com.